PhD Career Prospects by the Numbers
A data-driven profile on the types of work that STEM PhDs pursue and their pay scales, based on employment statistics from the National Science Foundation (NSF) and U.S. Department of Labor. View graphs only here.

Part 1: Labor Supply & Demand
PhDs Contribute to Strong Labor Supply in Technical Professions
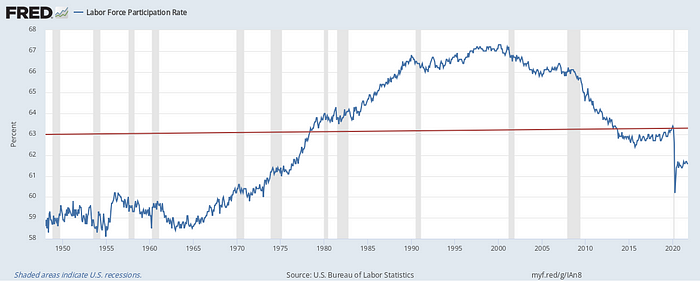
The labor force participation rate is the percentage of the U.S. population who are either working or actively looking for work. It is a key indicator of labor supply and reflects the willingness of individuals to perform economically impactful work (Fig 1).

Labor force participation steadily increased from 1948 to its peak in 2000 as a direct result of women entering the workforce in post-WWII America (female participation almost doubled from 32% to 60% during that time period; not shown). After the dotcom bubble burst in early 2000, approximately 1% of the population permanently dropped out of the labor market and an additional 3% permanently dropped out following the 2008 Global Financial Crisis. Participation flattened out in early 2015 and gradually started to increase until the 2020 COVID-19 Pandemic, which prompted a steep drop-off in participation as non-essential economic activity came to a grinding halt. In early 2021, safe & effective vaccines became widely available in developing countries and federally-mandated quarantines were lifted, which emboldened Americans to re-enter the labor force. Of particular note, the employment data for PhDs cited later in the report reflects market conditions in December 2019 (Fig 1, red line), a period of relatively stable labor supply.

Labor force participation rates among doctoral recipients is 23.1% higher than the national average (86.4% vs. 63.3%). Interestingly, participation is higher among PhDs systematically across all professions, demonstrating the overwhelming willingness of these individuals to seek out economically impactful work (Fig 2). Professions in Engineering & Data Science skew towards higher participation while those in Non-STEM and Social Service fields skew lower, although they are all more than 5% above the national average.
Demand for PhDs is Robust Among Employers
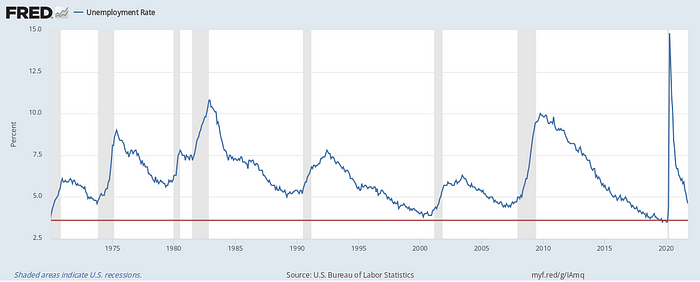
The unemployment rate is the percentage of the U.S. population who are not employed but are actively looking for work. It is a key indicator of labor demand and reflects the willingness of employers to hire new entrants or existing participants in the labor force (Fig 3).

Unsurprisingly, unemployment tends to spike during recessions (Fig 3, shaded regions) and decline during economic expansions. The most dramatic uptick in U.S. history occurred as a result of the 2020 COVID-19 Pandemic, but the data series covering PhDs takes place in December 2019, when unemployment reached a multi-decade low of 3.6% (Fig 3, red line).

Unemployment rates among doctoral recipients are 2.2-times lower than the national average (1.6% vs. 3.6%). Furthermore, unemployment among all doctoral professions are lower than the national average, with the exception of non-STEM teachers (4.5%) and the arts/humanities (3.7%). STEM pre-college teachers are associated with the third highest unemployment rate (3.4%), perhaps due to the underfunding of public schools in areas where state & local governments generate less income. Professors in various fields are clustered at the lower end of the unemployment range, with computer science & physics professors 9-times less likely to be unemployed than the national average. This probably results from the unique level of job security extended to tenured faculty.
Altogether, both the supply of PhDs looking for economically impactful work and the demand for PhDs among the relevant employers are stronger than average — a gratifying payoff for the 4–6-year trial by fire known as graduate school.
Part 2: Career Trends & Pay Scales
For those looking for their specific area of study, PhDs are grouped into three overarching fields that are subdivided into specialties: Life Sciences (biology-, chemistry-, and physics-related), Engineering & Data Science (math-, CS/IT-, and engineering-related), and Social Services (economics, political science, demographic studies, psychology, nursing, pharmacy, public health, and other healthcare-related service professions).
Academia or Industry? (or Government)
If I had $5 for every time this debate was brought up during career conversations, I’d be able to retire straight out of graduate school. The question lacks a “one size fits all” answer; it depends on one’s specialized area of study.

The majority of translational Life Science specialties — including chemistry, immunology, bioinformatics, pharmacology/toxicology, and food/animal sciences — tend to enter the private sector (Fig 5). The majority of nascent specialties (genetics, neuroscience) or those involving active surveillance of various ecosystems (botany, zoology, epidemiology, nutrition, astrophysics, wildlife management) tend to be situated in academia or government. Nevertheless, a sizeable commensurate of Life Science PhDs are distributed across both academia and industry.

Engineering & Data Science PhDs are overwhelmingly recruited into the private sector, with only five of the 16 specialties associated with a minority allocation (Fig 6). Pure mathematics exists as a notable outlier, one that is uniquely suited to an academic environment.

In contrast to Engineering & Data Science PhDs, Social Service PhDs are overwhelmingly retained in academia, with only specialties in applied psychology and pharmacy associated with a majority industry allocation (Fig 7). Surprisingly, only 6% of political science PhDs actually enter into government roles, with the majority likely residing as academic consultants.
Job Functions Vary Widely between Specialized Areas of Study
Life Science PhDs and Engineering & Data Science PhDs are more R&D-heavy than Social Service PhDs, which more often tend to pursue teaching or professional service roles (Fig 8, 10, 12). Organizational psychology is a notable outlier and the only specialty among all three fields whereby a plurality of PhDs occupy management/sales/administrative roles (Fig 12). Life Science R&D focus is fairly balanced between Applied and Basic R&D roles (Fig 9). In contrast, very few Engineering & Data Science PhDs engage in Basic R&D, with the exception of applied & pure mathematics (Fig 11). Engineering & Data Science R&D focus clusters into two subgroups: those with an overwhelming majority in Applied R&D and those with about 50% Basic R&D (Fig 13).


Pay Scale Depends on Sector of Employment
The medial annual salary for doctorate recipients is approximately 3.5-times higher than the national average ($119,000 vs. $35,000). A weighty caveat is that this salary represents all PhDs regardless of age and seniority. The median annual salary for PhDs less than 5 years after degree conferral is $90,000 and rises to $148,000 after more than 25 years. Likewise, the median annual salary for PhDs less than 35 years old is $93,000 and peaks at $133,000 for those approaching retirement age between 55–59 years old (Fig 14). Salaries for people age 60 or older modestly decline for Economics, Non-STEM, and CS & IT as well as in the general U.S. population. However, earnings continue to increase after age 60 within the Life Sciences, Chemistry & Physics, Mathematics, and Psychology.

For-profit companies consistently rank among the highest paying institution type among Life Science, Engineering & Data Science, and Social Service fields whereas non-university educational institutions consistently rank among the lowest paying institution type (Fig 15, 16, 17). Salaries with the Federal Government in Life Science and Social Service fields are almost equivalent to those offered by for-profit companies, perhaps to outcompete industry for subject matter experts and fill differentiated roles in agencies like the FDA, HHS, CDC, Federal Reserve, and Treasury. Self-employed cell/molecular biologists are associated with the highest median annual salary ($218,000), followed by corporate computer scientists & think-tank economists tied for 2nd place ($188,000), corporate economists in 3rd place ($179,000), self-employed mathematicians in 4th place ($167,000) and corporate electrical & computer engineers in 5th place ($160,000).


Building Generational Wealth Depends on Investment Decisions
Finally, it should be noted that how one chooses to allocate their disposable income has a greater impact on a person’s cumulative earnings potential than the size of their annual compensation package. This has profound long-term financial and lifestyle implications — from comfortably affording large purchases as a young adult (ex. car, house), to covering expenses associated with children during middle age (ex. diapers, activities, education), to saving for retirement at advanced age.

The expected salaries in each age bracket, described previously in Fig 14, were used to extrapolate the cumulative wealth that either a PhD-holding person (red) or person in the general U.S. population (black) could be expected to generate throughout their lifetime (Fig 18). Since doctoral salaries are $21,434 higher, they can expect to accumulate wealth at a faster pace resulting in a $1.2 million surplus (shaded red) by the age of 75. However, this trajectory assumes that all compensation is paid out in cash and/or that the recipient makes zero investments (0% CAGR). If these same persons transfer all of their post-tax earnings into S&P 500 index funds (VFIAX, FXAIX) — which have generated an average post-tax return of ~7% since the index’s inception in 1926 — the PhD-recipient would be expected to increase their wealth by 3.75-times (+$8.8M). The general U.S. citizen could expect to overtake the aggregate wealth of the non-investing doctorate holder by their late 30’s and generate 2.3-times more wealth (+$4.2M) by age 75. This exercise illustrates the outsized impact that compounding interest makes in augmenting one’s salary, reinforcing the the oft-told adage that ‘it is never too early to start planning for retirement’.
References
U.S. Bureau of Labor Statistics
St. Louis Federal Reserve
National Science Foundation (NSF) — Survey of Doctorate Recipients, 2019
- Labor Force Participation Table 32–3
- Unemployment Table 32–1
- Sector segmentation Table 12–3
- Job Function segmentation Table 15–2
- Median Annual Salary, by research area Table 54
- Median Annual Salary, by age Table 67
